Performance & Profiling script
Note
The performance script got its own Sphinx extension: Sphinx-Performance.
This extension is based on the described script, but is more powerfull and better maintained. It can also be used for general performance analysis of Sphinx and its extensions.
The performance of Sphinx-Needs can be tested by a script called performance_test.py inside
folder /performance of the checked out github repository.
The performance can be tested with different amounts of needs, needtables and not Sphinx-Needs related
dummies (simple rst code).
Test series
To start a series of test with some predefined values, run python performance_test.py series
Running 8 test configurations.
* Running on 5 pages with 50 needs, 5 needtables, 5 dummies per page. Using 1 cores.
  Duration: 8.05 seconds
* Running on 5 pages with 50 needs, 5 needtables, 5 dummies per page. Using 4 cores.
  Duration: 6.75 seconds
* Running on 1 pages with 50 needs, 5 needtables, 5 dummies per page. Using 1 cores.
  Duration: 2.16 seconds
* Running on 1 pages with 50 needs, 5 needtables, 5 dummies per page. Using 4 cores.
  Duration: 2.36 seconds
* Running on 5 pages with 10 needs, 1 needtables, 1 dummies per page. Using 1 cores.
  Duration: 2.39 seconds
* Running on 5 pages with 10 needs, 1 needtables, 1 dummies per page. Using 4 cores.
  Duration: 2.34 seconds
* Running on 1 pages with 10 needs, 1 needtables, 1 dummies per page. Using 1 cores.
  Duration: 1.69 seconds
* Running on 1 pages with 10 needs, 1 needtables, 1 dummies per page. Using 4 cores.
  Duration: 1.70 seconds

RESULTS:

  runtime      pages       needs      needs    needtables    dummies    parallel
  seconds    overall    per page    overall       overall    overall       cores
---------  ---------  ----------  ---------  ------------  ---------  ----------
     8.05          5          50        250            25         25           1
     6.75          5          50        250            25         25           4
     2.16          1          50         50             5          5           1
     2.36          1          50         50             5          5           4
     2.39          5          10         50             5          5           1
     2.34          5          10         50             5          5           4
     1.69          1          10         10             1          1           1
     1.7           1          10         10             1          1           4

Overall runtime: 27.45 seconds.
But you can modify the details and set some static values by setting various parameters.
Just run python performance_test.py series --help to get an overview
Usage: performance_test.py series [OPTIONS]

  Generate and start a series of tests.

Options:
  --profile TEXT        Activates profiling for given area
  --needs INTEGER       Number of maximum needs.
  --needtables INTEGER  Number of maximum needtables.
  --dummies INTEGER     Number of standard rst dummies.
  --pages INTEGER       Number of additional pages with needs.
  --parallel INTEGER    Number of parallel processes to use. Same as -j for
                        sphinx-build
  --keep                Keeps the temporary src and build folders
  --browser             Opens the project in your browser
  --snakeviz            Opens snakeviz view for measured profiles in browser
  --debug               Prints more information, incl. sphinx build output
  --basic               Use only default config of Sphinx-Needs (e.g. no extra
                        options)
  --help                Show this message and exit.
Also if --needs, --pages or parallel is set multiple times, one performance test is executed per it.
Example:: python performance_test.py series --needs 1 --needs 10 --pages 1 --pages 10 --parallel 1 --parallel 4 --needtables 0 --dummies 0.
This will set 2 values for needs, 2 for pages and 2 for parallel. So in the end it will run 8 test
configurations (2 needs x 2 pages x 2 parallel = 8).
Running 8 test configurations.
* Running on 1 pages with 1 needs, 0 needtables, 0 dummies per page. Using 1 cores.
  Duration: 1.53 seconds
* Running on 1 pages with 1 needs, 0 needtables, 0 dummies per page. Using 4 cores.
  Duration: 1.64 seconds
* Running on 10 pages with 1 needs, 0 needtables, 0 dummies per page. Using 1 cores.
  Duration: 1.96 seconds
* Running on 10 pages with 1 needs, 0 needtables, 0 dummies per page. Using 4 cores.
  Duration: 2.01 seconds
* Running on 1 pages with 10 needs, 0 needtables, 0 dummies per page. Using 1 cores.
  Duration: 1.91 seconds
* Running on 1 pages with 10 needs, 0 needtables, 0 dummies per page. Using 4 cores.
  Duration: 1.93 seconds
* Running on 10 pages with 10 needs, 0 needtables, 0 dummies per page. Using 1 cores.
  Duration: 2.94 seconds
* Running on 10 pages with 10 needs, 0 needtables, 0 dummies per page. Using 4 cores.
  Duration: 2.48 seconds

RESULTS:

  runtime      pages       needs      needs    needtables    dummies    parallel
  seconds    overall    per page    overall       overall    overall       cores
---------  ---------  ----------  ---------  ------------  ---------  ----------
     1.53          1           1          1             0          0           1
     1.64          1           1          1             0          0           4
     1.96         10           1         10             0          0           1
     2.01         10           1         10             0          0           4
     1.91          1          10         10             0          0           1
     1.93          1          10         10             0          0           4
     2.94         10          10        100             0          0           1
     2.48         10          10        100             0          0           4

Overall runtime: 16.41 seconds.
Parallel execution
- versionadded:
0.7.1
You may have noticed, the parallel execution on multiple cores can lower the needed runtime.
This parallel execution is using the “-j” option from sphinx-build. This mostly brings benefit, if dozens/hundreds of files need to be read and written. In this case sphinx starts several workers to deal with these files in parallel.
If the project contains only a few files, the benefit is not really measurable.
Here an example of a 500 page project, build once on 1 and 8 cores. The benefit is ~40% of build time, if 8 cores
are used.
  runtime s    pages #    needs per page    needs #    needtables #    dummies #    parallel cores
-----------  ---------  ----------------  ---------  --------------  -----------  ----------------
     169.46        500                10       5000               0         5000                 1
     103.08        500                10       5000               0         5000                 8
Used command: python performance_test.py series --needs 10 --pages 500 --dummies 10 --needtables 0 --parallel 1 --parallel 8
The parallel execution can used by any documentation build , just use -j option.
Example, which uses 4 processes in parallel: sphinx-build -j 4 -b html . _build/html
Used rst template
For all performance tests the same rst-template is used:
index
Performance test
================

Config
------
:dummies: {{dummies}}
:needs: {{needs}}
:needtables: {{needtables}}
:keep: {{keep}}
:browser: {{browser}}
:debug: {{debug}}

Content
-------
.. contents::

.. toctree::

{% for page in range(pages) %}
   page_{{page}}
{% endfor -%}
pages
{{ title}}
{{ "=" * title|length }}

Test Data
---------

Dummies
~~~~~~~
Amount of dummies: **{{dummies}}**

{% for n in range(dummies) %}
**Dummy {{n}}**

.. note::  This is dummy {{n}}

And some **dummy** *text* for dummy {{n}}

{% endfor %}

Needs
~~~~~
Amount of needs: **{{needs}}**

{% for n in range(needs) %}
.. req:: Test Need Page {{ page }} {{n}}
   :id: R_{{page}}_{{n}}
{% if not basic %}   :number: {{n}}{% endif %}
   :links: R_{{page}}_{{needs-n-1}}
{% endfor %}

Needtable
~~~~~~~~~
Amount of needtables: **{{needtables}}**

{%  if basic %}
.. needtable::
   :show_filters:
   :columns: id, title, number, links
{% else %}
{% for n in range(needtables) %}
.. needtable::
   :show_filters:
   :filter: int(number)**3 > 0 or len(links) > 0
   :columns: id, title, number, links
{% endfor %}
{% endif %}
Profiling
With option --profile NAME a code-area specific profile can be activated.
Currently supported are:
NEEDTABLE: Profiles the needtable processing (incl. printing)
NEED_PROCESS: Profiles the need processing (without printing)
NEED_PRINT: Profiles the need painting (creating final nodes)
If this option is used, a profile folder gets created in the current working directory and a profile file with
<NAME>.prof is created. This file contains
CProfile Stats information.
--profile can be used several times.
These profile can be also created outside the performance test with each documentation project.
Simply set a environment variable called NEEDS_PROFILING and set the value to the needed profiles.
Example for Linux: export NEEDS_PROFILING=NEEDTABLE,NEED_PRINT.
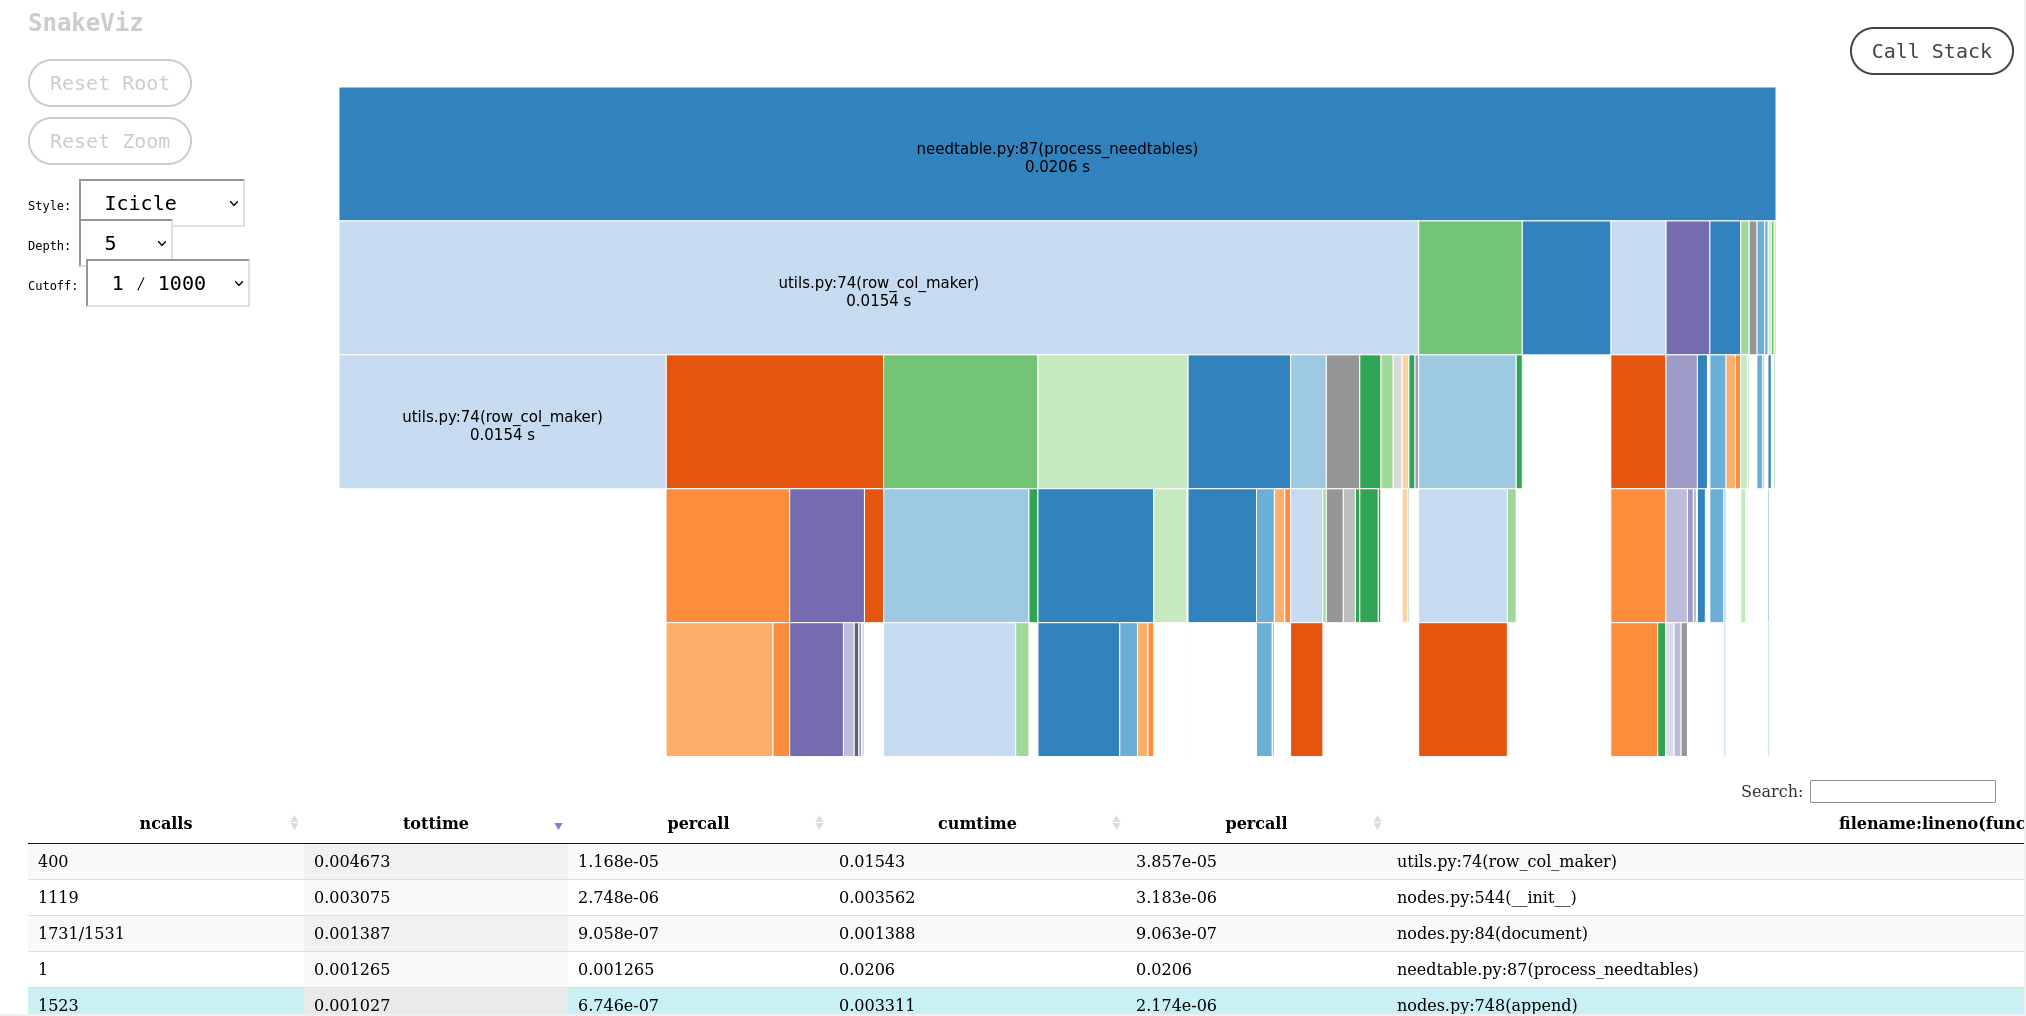
Analysing profile
Use snakeviz together with --profile <NAME> to open automatically a graphical analysis of the generated
profile file.
For this snakeviz must be installed: pip install snakeviz.
Example:
python performance_test.py series --needs 10 --pages 10 --profile NEEDTABLE --profile NEED_PROCESS --snakeviz
Measurements
The measurements were performed with the following setup:
Sphinx-Needs 0.7.0 on 1 core as parallel build is not supported by version.
Sphinx-Needs 0.7.1, with 1 core.
Sphinx-Needs 0.7.1, with 4 cores.
Test details |
0.7.0 with 1 core |
0.7.1 with 1 core |
0.7.1 with 4 cores |
|---|---|---|---|
30 pages with overall 1500 needs and 30 needtables |
55.02 s |
36.81 s |
34.31 s |
100 pages with overall 10.000 needs and 100 needtables |
6108.26 s |
728.82 s |
564.76 s |