Runtime debugging
New in version 1.3.0.
The build time of Sphinx is based on a lot of indicators, especially when Sphinx-Needs is used and self-written filters and warning functions got registered. Then it might happen that a build gets quite slow and it is hard to figure out why this is the case.
To get an overview about what takes how long, an integrated time measurement is available, which supports user defined elements and internal functions.
To activate it, simply add the following to the project conf.py file:
needs_debug_measurement = True
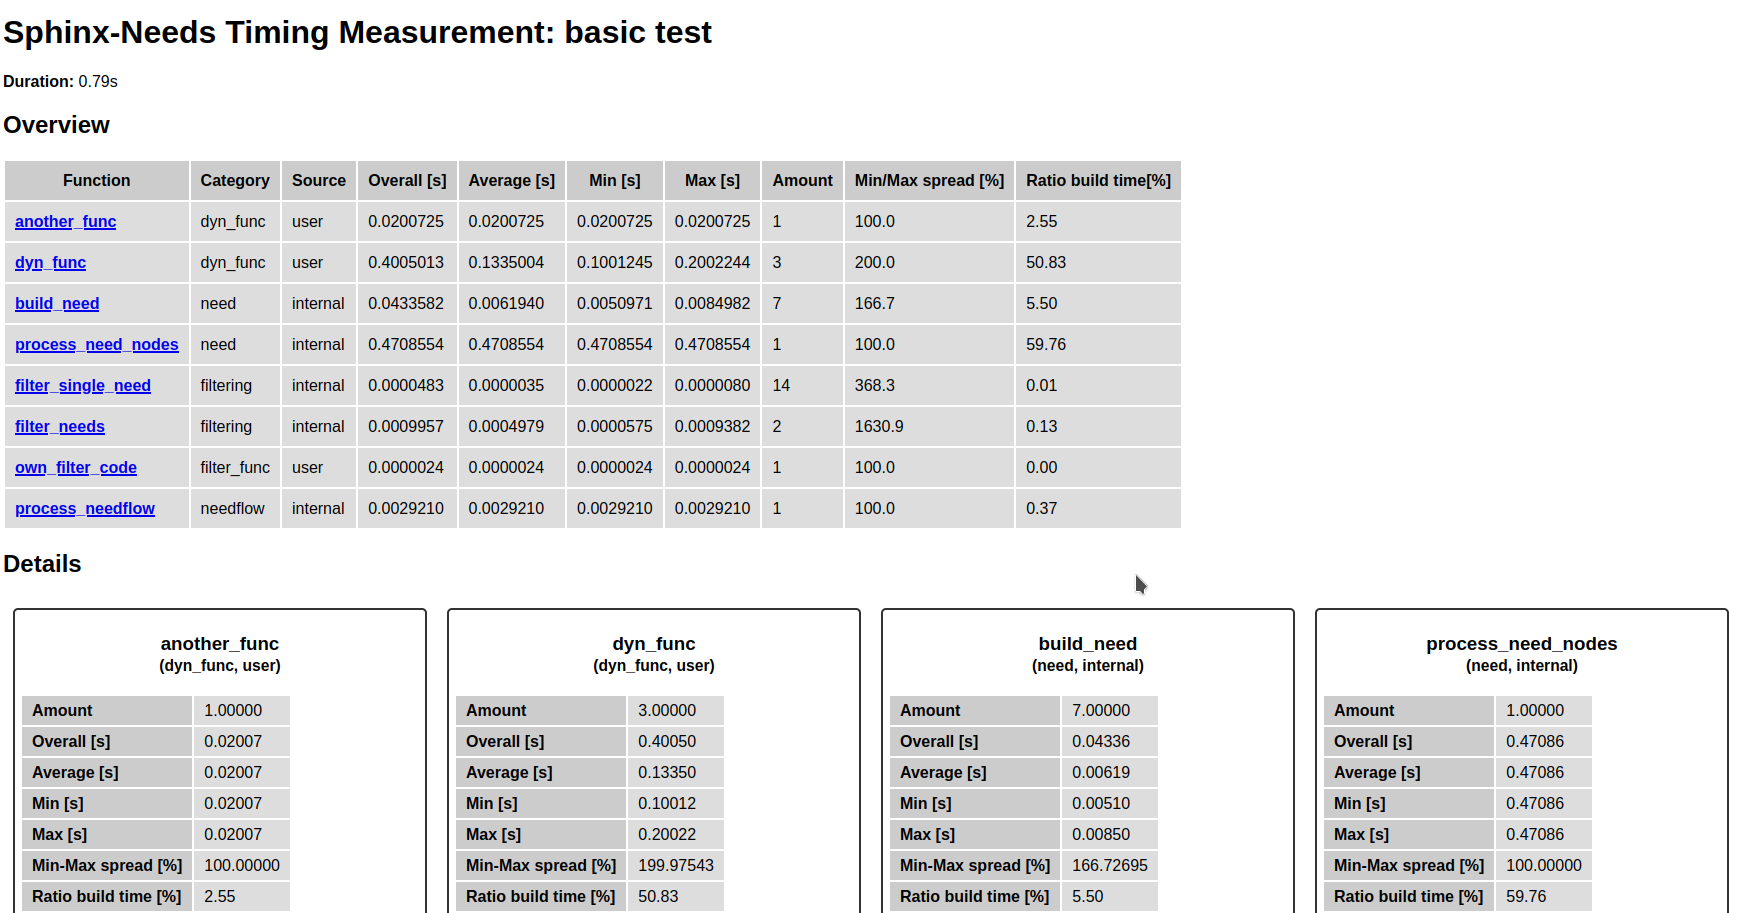
This will perform measurements and gives some output in three formats:
Some basic stats on the command line after the build
A JSON file
debug_measurement.jsonin the current build folder, which contains all captured dataA HTML report
debug_measurement.htmlin the current build folder.

HTML report example of timing measurements (Click to open complete HTML report)
Warning
Do not use this function in Sphinx parallel mode, as this will result in incorrect data. Mainly because the used result variables get not synced between the different worker processes.
Technical details
If you need to activate the measurement for additional Sphinx-Needs functions, use the measure_time() decorator.
-
measure_time(category: str | None =
None, source: str ='internal', name: str | None =None) Callable[[T], T]¶ Decorator for measuring the needed execution time of a specific function.
It measures:
Amount of executions
Overall time consumed
Average time of an execution as avg
Minimum time of an execution as min
Maximum time of an execution as max
For max also the used function parameters are stored as string values, to make it easier to reproduce the maximum case.
Usage as decorator:
from sphinx_needs.utils import measure_time @measure_time('my_category') def my_cool_function(a, b,c ): # does something- Parameters: