needbar
Added in version 0.7.5.
needbar adds a bar-chart to your documentation:
Example 1
.. needbar::

   5,20,15
   10,15,10
   15,10,20
   20,15,10

Each content value gets interpreted either as a static value or as a Filter string. The amount of found needs by the filter string is then used as value.
A static value has to be written as a non-negative integer, like 10.
Anything else is read as a filter string, which counts the needs it is true for:
a field name such as tags counts the needs whose tags are not empty, and True counts every need.
A filter that is any other constant, such as 10.5, -5 or 'x', says nothing about a need,
so it gives a needs.filter warning and counts zero.
needbar used to take no filter options at all, and this page said so.
The four filter options :filter:, :status:,
:tags: and :types: are now accepted, as the chart’s scope – the needs
its content cells are counted over – see common filters.
:filter-func: and :filter_warning: are still not available on it:
the data comes from the content, and a bar chart with only zeros is drawn as an
empty chart rather than replaced by a text.
The cypher option is accepted and then ignored.
A chart that is to count the same needs in ubCode and in a Sphinx build
therefore states its scope twice: once as the query ubCode reads, and once as
the four options Sphinx-Needs reads.
See ubCode compatibility.
Note
One image file is written per needbar,
in the first image type the document engine accepts that Matplotlib can produce.
For the HTML builders that is SVG.
Options
Example with all options used:
Example 2
.. needbar:: Full bar chart
   :legend:
   :colors: #ffcc88, #ffcc00, #444444
   :text_color: crimson
   :style: dark_background
   :x_axis_title: x_axis_title
   :xlabels_rotation: 90
   :xlabels: a, b, c
   :y_axis_title: y_axis_title
   :ylabels: FROM_DATA
   :ylabels_rotation: 45
   :separator: ;
   :stacked:
   :show_top_sum:
   :show_sum:
   :sum_rotation: 90
   :transpose:
   :horizontal:

   Z; 5;20;15
   Y;10;15;10
   X;15;10;20
   W;20;15;10

title
You can specify the headline of the bar chart using the title argument.
Example 3
.. needbar:: Title example

   5,20,15
   10,15,10
   15,10,20
   20,15,10

It is possible to create bar charts without title.
Example 4
.. needbar::

   5,20,15
   10,15,10
   15,10,20
   20,15,10

content
In the example below, we fetch the :xlabels: and :ylabels: options from the content using FROM_DATA with the labels.
You can use white spaces to format the table to improve readability.
From the content, we interpret each value either as a static value or as a Filter string. We get the bar chart’s data (values) from the amount of need objects found by the filter string.
Every content line must have the same amount of cells; a line that does not, an empty line among them included, ends the build.
Below is a more realistic example with data fetched from filters, together with hardcoded data:
Example 5
.. needbar:: A more real bar chart
   :legend:
   :xlabels: FROM_DATA
   :ylabels: FROM_DATA

                ,                           open ,                          in progress ,                          closed ,                          done ,                          implemented , number
     Requirement, type=='req' and status=='open', type=='req' and status=='in progress', type=='req' and status=='closed', type=='req' and status=='done', type=='req' and status=='implemented', 5
            Test, type=='test' and status=='open', type=='test' and status=='in progress', type=='test' and status=='closed', type=='test' and status=='done', type=='test' and status=='implemented', 7
   Specification, type=='spec' and status=='open', type=='spec' and status=='in progress', type=='spec' and status=='closed', type=='spec' and status=='done', type=='spec' and status=='implemented', 9

legend
You can place a legend on the barchart by setting the :legend: flag.
The :legend: flag does not support any values.
Example 6
.. needbar:: Legend example
   :legend:

   5,20,15
   10,15,10
   15,10,20
   20,15,10

axis title
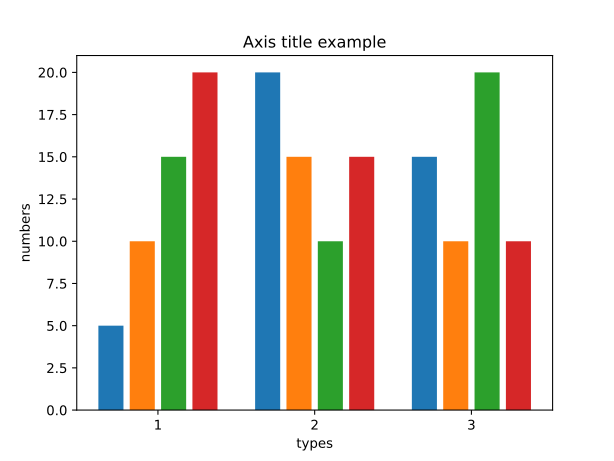
You can enable axis titles on the barchart by setting the :x_axis_title: or :y_axis_title: options.
Hint
If you use horizontal or transpose, the meaning of :x_axis_title: and :y_axis_title: must be understandable.
So you have to change the description accordingly.
Example 7
.. needbar:: Axis title example
   :x_axis_title: types
   :y_axis_title: numbers

   5,20,15
   10,15,10
   15,10,20
   20,15,10
labels
:xlabels: to set labels for columns of the data.:ylabels: to set labels for row of the data.You can define the :xlabels: and/or :ylabels: by setting a comma separated string.
The amount of labels must match the amount of values/lines from content.
Also, you can set the :xlabels: and/or :ylabels: value to FROM_DATA to fetch the labels from the content.
Labels that are neither given nor taken from the content are numbered
1, 2, … one per column or row.
Warning
A different amount of labels than columns, or than rows, currently ends the build, rather than giving a warning.
Hint
In a normal bar chart, we use the :xlabels: as the labels of the x-axis on the chart and the :ylabels: as the labels of legend.
But if you use horizontal or transpose, the meaning of :x_axis_title: and :y_axis_title: will change automatically.
Example 8
.. needbar:: Labels example 1
   :legend:
   :xlabels: a, b, c
   :ylabels: Z, Y, X, W

    5,20,15
   10,15,10
   15,10,20
   20,15,10

.. needbar:: Labels example 2
   :legend:
   :xlabels: FROM_DATA
   :ylabels: FROM_DATA

    , a, b, c
   Z, 5,20,15
   Y,10,15,10
   X,15,10,20
   W,20,15,10


stacked
You can render the barchart in a stacked design by setting :stacked: flag.
The :stacked: flag does not support any values.
Example 9
.. needbar:: stacked example
   :stacked:

   5,20,15
   10,15,10
   15,10,20
   20,15,10

show_sum
You can render the barchart with detailed information of the height of each bar by setting the :show_sum: flag.
The :show_sum: flag does not support any values and it’s useful with the stacked option enabled.
Example 10
.. needbar:: show_sum example 1
   :show_sum:

   5,20,15
   10,15,10
   15,10,20
   20,15,10

.. needbar:: show_sum example 2
   :stacked:
   :show_sum:

   5,20,15
   10,15,10
   15,10,20
   20,15,10


show_top_sum
You can render the barchart with detailed information of the height of each bar above by setting the :show_top_sum: flag.
The :show_sum: flag does not support any values and it’s useful with the stacked option enabled.
Example 11
.. needbar:: show_top_sum example 1
   :show_top_sum:

   5,20,15
   10,15,10
   15,10,20
   20,15,10

.. needbar:: show_top_sum example 2
   :stacked:
   :show_sum:
   :show_top_sum:

   5,20,15
   10,15,10
   15,10,20
   20,15,10


horizontal
You can render the bar chart with horizontal bars by setting the :horizontal: flag.
The :horizontal: flag does not support any values and it’s useful with the stacked option enabled.
Hint
The meaning of labels will change automatically with the usage of :horizontal:. We will use the
:x_axis_title: as labels for the y-axis and use the :y_axis_title: as the values in the legend.
Example 12
.. needbar:: horizontal example 1
   :horizontal:

   5,20,15
   10,15,10
   15,10,20
   20,15,10

.. needbar:: horizontal example 2
   :stacked:
   :legend:
   :show_sum:
   :horizontal:
   :xlabels: FROM_DATA
   :ylabels: FROM_DATA

    , a, b, c
   Z, 5,20,15
   Y,10,15,10
   X,15,10,20
   W,20,15,10


transpose
You can transpose the data in the content by setting the :transpose: flag.
The idea is, you can try to see the data from different point of view, without refactoring.
The :transpose: flag does not support any values and it’s useful with big content tables.
Hint
Using the
:transpose:flag, transposes the:x_axis_title:and:y_axis_title:fetched from the content data or specified with labels but does not transpose the extra axis title.Remember that with the
:transpose:flag, the length and height of the content data changes, not to think about the width of matching elements, like colors. Please review the impact of:transpose:before using it.
Example 13
.. needbar:: transpose example 1
   :transpose:

   5,20,15
   10,15,10
   15,10,20
   20,15,10

.. needbar:: transpose example 2
   :legend:
   :stacked:
   :show_sum:
   :transpose:
   :xlabels: FROM_DATA
   :ylabels: FROM_DATA

    , a, b, c
   Z, 5,20,15
   Y,10,15,10
   X,15,10,20
   W,20,15,10


rotation
:xlabels_rotation: to set rotation of labels for x-axis on the diagram.:ylabels_rotation: to set rotation of labels for y-axis on the diagram.:sum_rotation: to set rotation of labels for bars on the diagram.Each takes the rotation in degrees, written as a non-negative integer.
A value such as -45 or 45.5 is currently dropped without a warning,
so use 315 instead of -45.
:sum_rotation: only has an effect together with :show_sum: or :show_top_sum:.
Example 14
.. needbar:: rotation example
   :legend:
   :xlabels: a, b, c
   :xlabels_rotation: 90
   :ylabels: Z, Y, X, W
   :ylabels_rotation: 40
   :show_top_sum:
   :show_sum:
   :sum_rotation: 90

    5,20,15
   10,15,10
   15,10,20
   20,15,10

separator
You can specify a custom separator between the values in the content by setting the :separator: option.
The default separator is ,, which is also legal inside a Filter string —
in a list, a tuple or a function call.
Such a filter is split into pieces by the default separator, and the build then ends on
the resulting invalid syntax, so give a separator of your own whenever a cell contains a
comma:
.. needbar::
   :separator: ;

   status in ['open', 'closed']; status == 'done'
The :separator: is a string that supports any symbols, and is used exactly as
written: quoting it, as in :separator: "|", makes the separator the three
characters, not the one.
Example 15
.. needbar:: separator example
   :separator: -

   5-20-15
   10-15-10
   15-10-20
   20-15-10

colors
:colors: takes a comma separated list of color names and uses them for the bar charts.
See Matplotlib documentation of supported colors for a complete list of color names.
But besides names, :colors: options also supports hex-values like #ffcc00.
Hint
In a normal bar chart, we use the :colors: for the legend and bars itself.
One color is used per row of the content, so transpose changes how many are needed.
Fewer colors than rows is not an error: the remaining rows fall back to the default
palette, starting again at its first color. They are therefore not colored as they
would have been without the option.
A color Matplotlib does not know ends the build.
Example 16
.. needbar:: colors example
   :legend:
   :colors: lightcoral, gold, #555555, #888888
   :xlabels: FROM_DATA
   :ylabels: FROM_DATA

    , a, b, c
   Z, 5,20,15
   Y,10,15,10
   X,15,10,20
   W,20,15,10

text_color
:text_color: defines the color for text inside the bar chart and the labels.
Example 17
.. needbar:: text_color example
   :legend:
   :text_color: green
   :xlabels: FROM_DATA
   :ylabels: FROM_DATA

    , a, b, c
   Z, 5,20,15
   Y,10,15,10
   X,15,10,20
   W,20,15,10

style
:style: activates a complete style (colors, font, sizes) for a bar chart.
It takes a string, which must match the
supported Matplotlib style names.
Useful styles are for example:
default
classic
Solarize_Light2
dark_background
grayscale
Example 18
.. needbar:: style example
   :legend:
   :style: Solarize_Light2
   :xlabels: FROM_DATA
   :ylabels: FROM_DATA

    , a, b, c
   Z, 5,20,15
   Y,10,15,10
   X,15,10,20
   W,20,15,10

common filters
On a chart these four options do not select what is shown – the content decides
that – they select the needs the chart counts over: its scope.
The scope is resolved once for the whole chart, and every content cell is then
counted as its own result restricted to the scope, so a cell counts a need only
if the scope holds that need as well.
A static value such as 10 counts no needs at all and is never affected.
A scope restricts what a cell counts, not what its filter can see:
the needs variable inside a content cell is exactly what it would be on the
same chart without a scope.
If the scope selects nothing, every filter cell counts zero, and a bar chart of
only zeros is drawn as an empty chart – needbar has no :filter_warning:
and no text to put in place of the chart, unlike needpie.
Parts follow their need: :status:, :tags: and :types: select needs,
and the parts of a selected need are in the scope with it, while :filter:
is evaluated over needs and parts alike.
This is what the same four options do on needlist, so a scope and a
needlist written with the same options select the same needs.
Writing the scope twice, as the four options and as a :cypher: query, is the
portable form: ubCode gives the query precedence over the options, Sphinx-Needs
ignores the query and applies the options, so the two engines agree for as long
as the two spellings do.
An option value is never split by the :separator:, which a content cell is,
so :filter: status in ['open', 'closed'] works as written while the same
text in a cell would need a separator of its own.
Example 19
.. needbar:: Open requirements and specifications
   :xlabels: requirement, specification
   :ylabels: open
   :status: open
   :cypher: n.status = 'open'

   type == 'req', type == 'spec'
